How Weather Affects Your Running Performance: A Complete Guide
Temperature, humidity, wind, air quality, rain, and UV — the science behind how each weather factor impacts your run, and how to plan around them.
What temperature produces the fastest marathon times? Ely et al.'s 2007 study analyzed decades of data from the Boston, New York, Twin Cities, and other major marathons and found that the best performances occur at a WBGT (Wet Bulb Globe Temperature) of 5–10°C. For most runners, the sweet spot in air temperature is about 10–15°C (50–59°F). The slower you are, the more heat hurts — when elite runners slow by 4.5%, mid-to-back-of-pack runners slow by up to 12.8%.
Then there's wind. A 30 km/h headwind increases energy expenditure by 37%, while the same tailwind saves only 9% (Beaumont & Polidori, 2025). On an out-and-back course, "the tailwind on the way back will cancel it out" is physically wrong.
This guide covers how temperature, humidity, wind, air quality, rain, and UV affect your running performance and safety — backed by peer-reviewed research. Whether you're a beginner or a marathon veteran, you'll see weather differently after reading this.
Temperature — The Single Most Important Variable
Temperature is the most dominant weather factor affecting running performance.
The Optimal Range
A large-scale study analyzing 1,258 endurance races across 42 countries (Otani et al., Medicine & Science in Sports & Exercise, 2021) found peak performance in the WBGT range of 7.5–15°C. By gender, men perform best at approximately 5.9°C (42.6°F) and women at 7.7°C (45.9°F). For most recreational runners, an air temperature of 10–15°C (50–59°F) is the comfort zone.
How Heat Degrades Performance
Above the optimal range, marathon performance drops by approximately 0.3–0.4% per 1°C increase in WBGT. That sounds small, but it compounds — in high heat, slower runners can be 12.8% slower than at optimal temperature.
The mechanism: as core temperature rises, the body redirects blood from working muscles to the skin for cooling. This forces heart rate up and increases oxygen demand at any given pace. A core temperature above 40°C (104°F) is a risk indicator for heat stroke, though trained athletes have been documented finishing races above this threshold — the 2009 study by Ely et al. (Journal of Applied Physiology) showed 40°C is not an absolute fatigue cliff, but the risk of heat illness rises sharply above it.
How Cold Affects Running
Cold demands more energy than most runners expect. VO2max begins declining below 10°C (50°F), and exercising at 9°C increases glycogen depletion by 23% compared to 21°C (Jacobs, Romet & Kerrigan-Brown, European Journal of Applied Physiology, 1985). Shivering dramatically accelerates glycogen consumption, leading to faster-than-expected energy depletion during prolonged cold-weather runs.
Dehydration remains a risk in cold weather — cold air suppresses thirst and increases urine production.
Feels-Like Temperature
The feels-like temperature — which accounts for wind chill and heat index — matters more than air temperature alone. The ACSM recommends caution when the heat index exceeds 32°C (90°F) or wind chill drops below -27°C (-18°F).
Humidity and Dew Point — The Number Runners Should Actually Check
Why does humid weather feel so brutal? Your body's primary cooling mechanism is sweat evaporation. When the air is already saturated with moisture, sweat can't evaporate — it pools on your skin or soaks into clothing, trapping body heat. In humid conditions, the body must redirect more blood to the skin for cooling, leaving less available for working muscles.
Why Dew Point Beats Relative Humidity
Relative humidity fluctuates with temperature, which can be misleading — 90% humidity at 6 AM and 90% at 2 PM represent completely different amounts of moisture in the air. Dew point measures the absolute moisture content regardless of temperature, making it a far more reliable indicator for runners.
Dew Point Guide for Runners
| Dew Point | How It Feels | Impact on Running |
|---|---|---|
| Below 50°F | Comfortable | Optimal conditions, PR potential |
| 50–59°F | Pleasant | Hard efforts still unaffected |
| 60–64°F | Slightly sticky | Performance starts declining, minor pace adjustment |
| 65–69°F | Noticeably humid | Hard efforts become difficult |
| 70–74°F | "Swampy" | Expect significant pace degradation |
| 75°F+ | Oppressive | Performance drops 12–15%+ |
Wind — The Headwind-Tailwind Asymmetry
Wind is the most underestimated weather factor in running. Many runners assume "headwind out, tailwind back" cancels out. Physics says otherwise.
37% vs. 9% — The Science of Asymmetry
A 2025 study by Beaumont & Polidori (International Journal of Sports Science and Coaching) measured aerodynamic forces at three running speeds (10, 15, 20 km/h) across five wind speeds (0–30 km/h):
- 30 km/h headwind: energy expenditure increases 37%
- 30 km/h tailwind: energy expenditure decreases only 9%
- Running at 13.7 km/h into a 20 km/h headwind requires the same metabolic energy as running at 19.4 km/h with a 20 km/h tailwind
Air resistance scales with the square of wind speed — a 10 mph wind creates 4 times the resistance of a 5 mph wind. On out-and-back courses, the tailwind leg never compensates for the headwind leg. On windy days, run by effort, not pace.
Air Quality — The Invisible Danger
You can feel temperature and wind. You can't see air quality — which makes it more dangerous.
AQI Guide for Runners
| AQI | Level | Running Recommendation |
|---|---|---|
| 0–50 | Good (Green) | All activity safe |
| 51–100 | Moderate (Yellow) | Most runners safe; sensitive individuals should reduce intensity |
| 101–150 | Unhealthy for Sensitive Groups (Orange) | Run in the morning; choose lighter workouts |
| 151–200 | Unhealthy (Red) | Move exercise indoors |
| 201+ | Very Unhealthy to Hazardous | Avoid all outdoor exertion |
PM2.5 and Your Lungs
During running, your breathing rate increases dramatically, pulling fine particulate matter (PM2.5) and ozone deeper into your lungs than at rest. Research shows that exercising at PM2.5 concentrations above 80 μg/m³ for 14 weeks increased inflammation markers and blocked lung capacity improvements.
The 1.5-Million-Person Study
A 2025 pooled analysis of cohort studies involving 1.5 million adults (BMC Medicine) found that:
- At PM2.5 below 25 μg/m³: recommended physical activity reduced all-cause mortality by 30%
- At PM2.5 above 25 μg/m³: the same exercise reduced mortality by only 12–15%
- At PM2.5 above 35 μg/m³: the exercise benefit for cancer mortality was no longer statistically significant
- 46% of the global population lives in regions at or above 25 μg/m³
The WHO's 2021 air quality guidelines halved the annual PM2.5 standard from 10 μg/m³ to 5 μg/m³.
Rain, UV, and Running After Dark
Rain
Rain directly increases body heat loss and energy expenditure, reducing running performance and increasing perceived effort (The Journal of Sports Medicine and Physical Fitness, 2019). Wet clothing adds weight and drag, and wet surfaces increase slip risk. Experts recommend lowering pace expectations by 10–20% in rain. Shorter strides and a midfoot strike improve stability on wet surfaces.
UV Exposure
At UV Index 3–5 (moderate), apply SPF 30+ sunscreen. At 6–7 (high), reduce midday exposure. At 8+ (very high to extreme), avoid running during peak hours (10 AM – 4 PM).
A study of 210 marathon runners found that runners had significantly more atypical melanocytic naevi and solar lentigines than controls — both markers of elevated melanoma risk (Ambros-Rudolph et al., Archives of Dermatology, 2006). A separate survey of 2,445 runners found that only 23.5% had adequate sun protection behavior.
Running After Dark
77% of US pedestrian fatalities occur at night (NHTSA). Placing reflective gear on limbs (wrists, ankles, joints) increases driver recognition distance by 60–80% compared to torso-only placement. A Danish randomized controlled trial with nearly 7,000 cyclists found that high-visibility jackets reduced collision risk by 47%.
Heat Stroke and Hypothermia — When Weather Threatens Your Life
In extreme conditions, the concern shifts from performance to survival.
Heat Stroke
Exertional heat stroke occurs when core temperature exceeds 40°C (104°F) with central nervous system dysfunction. Data from the Falmouth Road Race (7-mile race) over 8 years (2012–2019) recorded 2.07 heat stroke cases per 1,000 participants — with a 100% survival rate thanks to on-site cold water immersion treatment (PMC, 2024). Notably, shorter races (5–15 km) have higher heat stroke rates than marathons because faster runners generate more metabolic heat.
Hyponatremia (Overhydration)
The danger in hot weather isn't only dehydration. In the 2002 Boston Marathon, 13% of runners had hyponatremia (dangerously low blood sodium), and 0.6% had life-threatening levels (New England Journal of Medicine). Drinking more than 1–1.5 liters per hour is a primary risk factor. Drink to thirst — not beyond it.
Hypothermia
Hypothermia begins when core temperature drops below 35°C (95°F). If you're wet from rain or sweat, it can occur even at 4.4°C (40°F). At a wind chill of -20°F, exposed skin can develop frostbite within 30 minutes; at -58°F, within 5 minutes (NWS). Heat acclimatization takes 10–14 days of repeated heat exposure (ACSM).
When to Skip Outdoor Running
- Heat index above 32°C (90°F) or WBGT above 28°C (82°F)
- Wind chill below -20°F
- AQI above 151 (Code Red)
- Visible lightning or audible thunder — lightning can strike from 16 km (10 miles) away
- Black ice on running surfaces
How to Plan Your Runs Around Weather
Understanding how weather affects running is one thing. Acting on it is another. The most effective approach is to plan your weekly running schedule by checking weather in advance — not deciding each morning whether to run.
SudoTool's Running Weather Scheduler was built for exactly this approach. Select your city and preferred running time, and it shows a 7-day weather forecast at that specific hour. Each day gets a color-coded Run Score (Good / Moderate / Poor) based on five factors: temperature, rain probability, wind speed, humidity, and AQI. A "Why?" button reveals which factors triggered the score — making it transparent, not a black box. The Best Days banner highlights your optimal running days for the week. Your city and time settings are saved automatically, and no data is sent to any server.
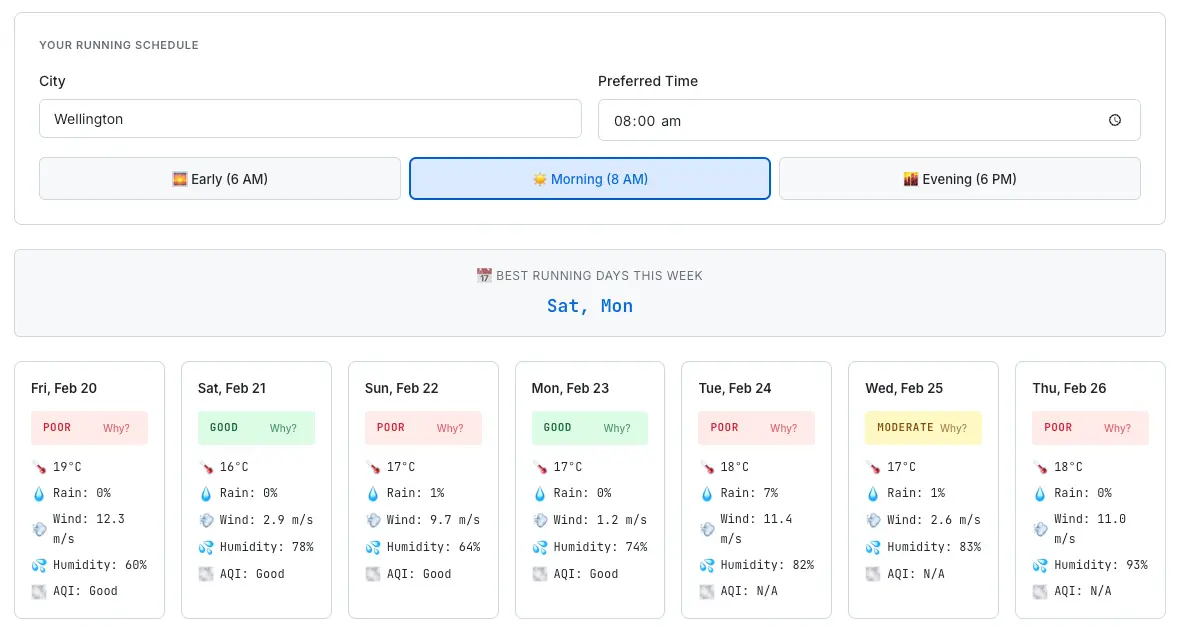
SudoTool Running Weather Scheduler — plan your weekly runs with 7-day weather forecasts and run scores at a glance.
Frequently Asked Questions
What's the best temperature for running?
Research shows the optimal WBGT for marathons is 5–10°C. For most recreational runners, an air temperature of 10–15°C (50–59°F) is the comfort zone. Above WBGT 15°C, performance declines by approximately 0.3–0.4% per degree.
Why is running in humidity so hard?
Your body cools itself through sweat evaporation. High humidity prevents sweat from evaporating, trapping body heat. The body must redirect more blood to the skin for cooling, leaving less available for your working muscles — making the same pace feel significantly harder.
Why is dew point more useful than relative humidity?
Relative humidity fluctuates with temperature, so the same number can mean very different moisture levels at different times of day. Dew point measures absolute moisture content regardless of temperature, making it a far more reliable indicator for planning your run.
Do headwind and tailwind cancel out on an out-and-back?
No. Air resistance scales with the square of wind speed. A 30 km/h headwind increases energy expenditure by 37%, while a 30 km/h tailwind only saves 9%. The headwind penalty always exceeds the tailwind benefit — wind is a net loss on any out-and-back course.
At what AQI should I stop running outdoors?
At AQI 151+ (Unhealthy / Red), the EPA recommends moving exercise indoors. At AQI 101–150 (Orange), people with respiratory conditions should reduce intensity. A study of 1.5 million adults found that at PM2.5 above 25 μg/m³, the mortality-reduction benefit of exercise drops from 30% to 12–15%.
Is drinking more water always safer in hot weather?
No. Overhydration causes hyponatremia (dangerously low blood sodium). In the 2002 Boston Marathon, 13% of sampled runners had hyponatremia. Drinking more than 1–1.5 liters per hour is a major risk factor. The safest approach is to drink to thirst — not beyond it.
What should I wear when running in the cold?
The ACSM recommends a three-layer system: (1) moisture-wicking base layer (polyester/polypropylene), (2) insulation layer (fleece/wool), (3) wind- and water-resistant outer shell. Dress as if it's 10–20°F (6–11°C) warmer than the actual feels-like temperature — you'll warm up once you start running.
Is it safe to run in the rain?
In light rain, yes — lower your pace expectations by 10–20% and shorten your stride for better traction. But avoid running in heavy rain with lightning, or on icy/frozen surfaces. Wet roads significantly increase slip risk.
Read the Weather, Run Smarter
Weather is the single most important external factor in running performance and safety. Three things to remember:
Temperature is king — the optimal WBGT is 5–10°C, with air temperature of 10–15°C for most runners. Above that, performance declines measurably. Check the dew point, not just humidity — dew point above 60°F means you should adjust your pace. Don't ignore air quality — invisible pollution can erase the health benefits of exercise entirely. Move indoors at AQI 151+.
If you want to plan your weekly runs around weather — checking temperature, rain, wind, humidity, and AQI at your preferred running time — try SudoTool's Running Weather Scheduler.
Curious about how this tool was built? Read how we built a browser-based running weather scheduler — the design decisions, technical trade-offs, and lessons learned along the way.