Building a Readability Checker with 7 Algorithms in Pure JavaScript
Every readability tool I found was missing something. Hemingway only uses one algorithm. Readable.com locks features behind a paywall. WebFX gives you a score but no highlighting. I wanted all seven major algorithms running in the browser, with real-time sentence highlighting and word-level improvement suggestions — no server, no signup, no paywall.
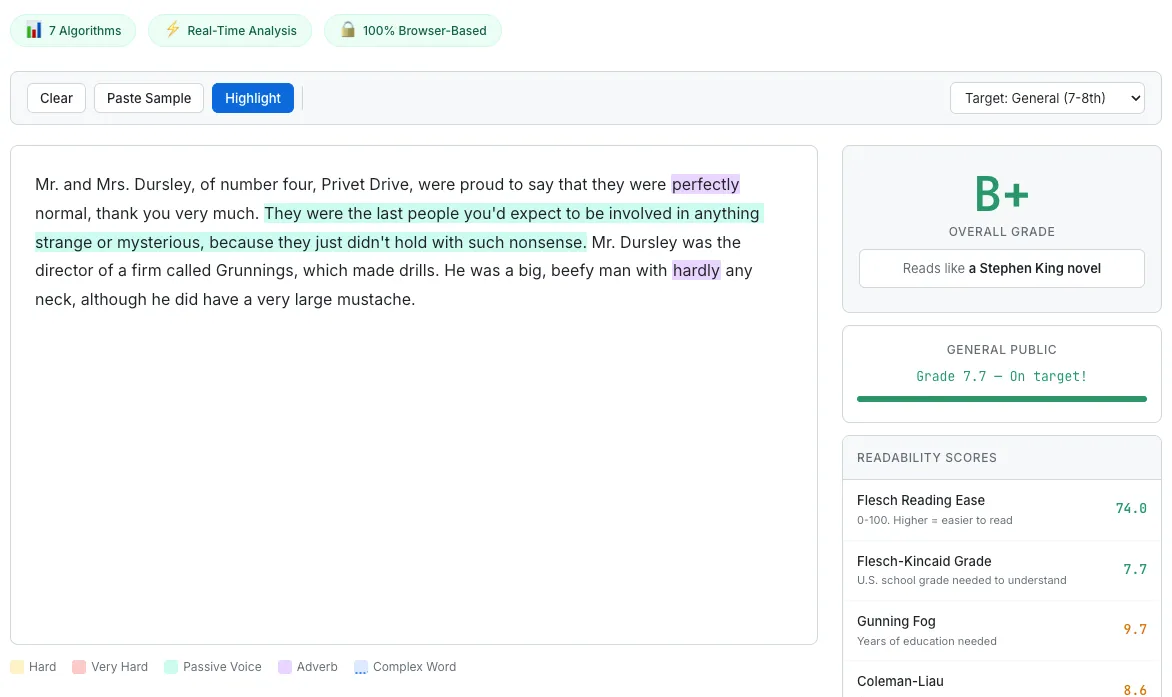
The Readability Score Checker analyzing Harry Potter — hard sentences highlighted in yellow, adverbs in purple, with seven algorithm scores in the sidebar.
Why I Built Another Readability Checker
When I started researching readability checker tools, I expected the space to be solved. It is not.
Hemingway Editor is the most popular option, and for good reason — it is clean, fast, and highlights hard-to-read sentences beautifully. But it uses a single algorithm under the hood. One perspective on your text. If your writing happens to score well on that particular formula but poorly on others, you would never know.
Readable.com offers multiple algorithms, but locks most of them behind a subscription. You can see the Flesch-Kincaid score for free, but want Coleman-Liau or SMOG? That will be $8 per month. For a calculation that takes a few milliseconds of JavaScript, the subscription model felt wrong.
WebFX Readability Test runs several algorithms, but it provides no visual highlighting. You get a table of scores and a grade level. What you do not get is any indication of which sentences are dragging your score down. A number without guidance is not actionable.
So I set out to build a tool that combined all three strengths: seven established readability algorithms, real-time sentence-level highlighting, and concrete word-level suggestions — all running entirely in the browser. No round trips, no accounts, no paywalls. The result is the Readability Score Checker.
Seven Algorithms, One Analysis Flow
The seven algorithms I implemented are Flesch-Kincaid Grade Level, Flesch Reading Ease, Gunning Fog Index, Coleman-Liau Index, SMOG Index, Automated Readability Index (ARI), and Dale-Chall Readability Score. Each formula has different inputs — some care about syllable counts, others about character counts, others about whether words appear on a specific “familiar words” list. But many of these inputs overlap.
Rather than running seven independent analyses, the tool collects all the raw counts it needs — syllables, characters, letters, complex words (three or more syllables), and Dale-Chall unfamiliar words — in one loop over the word list, then feeds those accumulated values into all seven formulas at once. The sentence splitting and word tokenization happen in their own traversals before this stats loop runs, so calling the entire process “single-pass” would be misleading. But the expensive syllable counting and dictionary lookups happen only once per word, and every formula draws from the same pool of results.
The composite grade is a weighted average: Flesch-Kincaid at 25%, and the remaining five grade-producing formulas at 15% each. I gave FK the highest weight because it is the most widely recognized and tends to correlate best with reader feedback in the studies I read. The result is a single letter grade (A+ through F) that synthesizes seven different perspectives on how difficult your text is.
For a deeper look at what each formula measures and when to trust which score, I wrote a companion post: Readability Scores Explained.
Syllable Counting Is Harder Than Expected
If you had told me that syllable counting would be one of the most time-consuming parts of this project, I would not have believed you. Counting syllables sounds simple: count the vowel groups. And for 80% of English words, that works.
The remaining 20% is where the complexity hides.
The basic approach counts consecutive vowel groups (a, e, i, o, u, y) as one syllable each. “beautiful” has three vowel groups (eau-i-u), and the function correctly returns 3. So far, so good.
Then you hit silent-e. The word “make” has two vowel groups (a and e), but only one syllable. The silent-e rule says: if the word ends in “e” and the vowel count is greater than one, subtract one. But this rule has exceptions. Words ending in “le” (like “candle”), “ee” (like “free”), and “ye” (like “eye”) do not follow the silent-e pattern — the final “e” in these cases is pronounced. So the code checks for these suffixes before applying the subtraction.
The -ed suffix introduces another set of rules. In “walked,” the -ed is silent — one syllable, not two. In “wanted,” the -ed is pronounced — two syllables. The rule: -ed adds a syllable only when preceded by “t” or “d.” Otherwise, it is silent. A similar pattern applies to -es: it adds a syllable after s, x, z, ch, and sh (“boxes” is two syllables), but not after most other consonants (“makes” stays one syllable).
I considered loading a pronunciation dictionary like CMU Pronouncing Dictionary, which maps 130,000+ words to their phoneme sequences. That would give near-perfect syllable counts. But the dictionary is over 3MB uncompressed, and every user would have to download it before the tool could produce any results. For a tool that is supposed to feel instant, that trade-off did not make sense. The heuristic approach runs in microseconds and achieves roughly 85–90% accuracy, which is good enough for readability scoring where small syllable errors tend to average out across a full text.
Sentence Splitting — Periods Are Not Always Endings
Sentence count is a core input for Flesch-Kincaid, Gunning Fog, and ARI. Get it wrong and three of your seven algorithms produce bad results. So accurate sentence splitting matters more than it might seem.
The naive approach — split on periods, exclamation marks, and question marks — breaks immediately. “Mr. Smith went to Washington.” is one sentence, not two. “The U.S. economy grew by 3.2% in Q4.” is one sentence, not four.
My solution uses a null character substitution approach. Before splitting, the code scans for 29 common abbreviations — Mr., Mrs., Ms., Dr., Prof., Inc., Ltd., Jr., Sr., St., Ave., Blvd., Dept., Est., Fig., Gov., i.e., e.g., vs., etc., Jan. through Dec., and several others. Each abbreviation’s period is temporarily replaced with a null character (\0). Then the regex splits on .!? followed by a space and a capital letter (or end of string). After splitting, the null characters are restored to periods.
This is not perfect. It will not handle every edge case — nested quotations, ellipses used as pauses, or abbreviations that are not in the list. But it handles the cases that appear most frequently in the kind of text people paste into a readability checker: blog posts, essays, articles, and business writing. For those genres, the accuracy is solid.
The Dale-Chall 3,000-Word List
The Dale-Chall formula takes a fundamentally different approach from the other six algorithms. Instead of measuring syllable count or sentence length, it asks: how many words in this text are not on a list of 3,000 words that the average fourth-grader understands?
The original word list was compiled in 1948 by Edgar Dale and Jeanne Chall and revised in 1995. I embedded the full list as a JavaScript Set literal directly in the source code. No network request, no lazy loading, no external file. When the page loads, the Set is already in memory and ready for O(1) lookups.
The downside is file size. The list adds roughly 15–20KB after gzip compression. For a tool that prioritizes instant startup, I considered whether this was acceptable. The alternative — fetching the list from a separate JSON file — would save on initial parse time but introduce a network dependency and a loading state. Since the Set initializes in under 5 milliseconds on any modern device, I decided the embedded approach was the right trade-off.
During analysis, every word in the text is lowercased and checked against the Set. Words not found are counted as “unfamiliar.” The percentage of unfamiliar words, combined with average sentence length, produces the Dale-Chall score. A text where more than 5% of words are unfamiliar gets an additional difficulty adjustment, which is why academic and technical writing almost always scores higher on Dale-Chall than on syllable-based formulas.
Highlighting — The Pain of contentEditable
Here is something I did not expect: the cursor problem in contentEditable took more development time than implementing all seven readability algorithms combined.
The idea is straightforward. As the user types or pastes text, the tool highlights hard sentences in yellow, very hard sentences in red, adverbs in purple, passive voice in blue, and complex words in orange. Real-time visual feedback, right in the editing area.
The obvious implementation — replace the innerHTML of the contentEditable div with highlighted HTML — works on the first render. But the moment you do it while the user is typing, the cursor jumps to the beginning of the div. Every keystroke resets the cursor position. The editing experience becomes unusable.
The fix involves two steps: saving the cursor position before the HTML replacement, and restoring it afterward. Saving is the easier part. The Range API gives you the current selection’s anchor node and offset. I walk the DOM to calculate a flat character offset from the start of the text content.
Restoring is harder. After the innerHTML replacement, the DOM tree is completely different. The original text node that contained the cursor might now be split across three <span> elements with different highlight classes. A TreeWalker traverses the new DOM tree, counting characters through each text node until it reaches the saved offset, then places the cursor there.
Paste events introduced another problem. When a user pastes from a word processor or a website, the clipboard contains HTML — <span> tags, <div> tags, inline styles, sometimes even <img> tags. If this HTML enters the contentEditable div, it breaks the highlighting logic and pollutes the text analysis. The solution is to intercept the paste event, read text/plain from the clipboard data, prevent the default paste behavior, and insert the plain text manually using document.execCommand('insertText').
Finally, performance. Re-highlighting on every keystroke is expensive for long texts. A 300-millisecond debounce ensures that the analysis only runs after the user pauses typing. This keeps the editing experience smooth while still feeling close to real-time.
“Reads Like...” — Giving Numbers Context
When I built the AI Token Counter, I learned something that changed how I think about utility tools: people respond to comparisons, not absolute numbers. “1,347 tokens” meant nothing to most users. “This costs 30x more on GPT-4o than on Gemini Flash-Lite” changed their behavior.
I applied the same principle to readability scores. A Flesch Reading Ease score of 42 is technically “difficult.” But what does “difficult” feel like? Is it a newspaper article? A legal contract? An academic paper?
So I mapped Flesch Reading Ease ranges to famous texts that most people have encountered. A score between 90 and 100 reads like a children’s book. Between 60 and 70, a newspaper article. Between 30 and 40, an academic journal. Below 10, an IRS tax code. The label next to your score says “Reads like: Academic Journal” and suddenly that abstract number has a visceral, concrete meaning.
I also added two sets of interactive presets. Six Famous Texts presets let you load passages from well-known works — so you can see how Harry Potter scores compared to a scientific abstract or a legal disclaimer. Six Target Audience presets configure the tool for specific readers — elementary school students, general public, business professionals, academic audience, technical documentation, or legal/regulatory writing. Each preset adjusts the grading thresholds and suggestions to match what that audience expects.
These presets serve the same purpose as the presets in the Token Counter: instant gratification. A user who lands on a blank text area does nothing. A user who clicks “Harry Potter” and immediately sees a B+ grade with yellow-highlighted sentences is engaged within two seconds.
Passive Voice and Adverbs
Beyond readability scores, the tool flags two common writing weaknesses: passive voice and excessive adverbs.
Passive voice detection uses a be-verb + past participle pattern. The code looks for any form of “to be” (is, am, are, was, were, be, been, being) followed by a past participle. For regular verbs, past participles end in -ed. For irregular verbs, I maintain a list of 89 irregular past participles — words like “written,” “broken,” “chosen,” “driven,” “frozen,” and “spoken.” When the pattern matches, the phrase is highlighted in blue.
Adverb detection looks for words ending in -ly. But not every -ly word is an adverb. “Family,” “only,” “early,” “lonely,” “friendly,” “lovely,” “holy,” “ugly” — these are adjectives or nouns. I maintain an exception list of 34 non-adverb -ly words to avoid false positives. When a genuine adverb is found, it is highlighted in purple with a tooltip suggesting removal or replacement.
The tool also provides over 60 simpler word alternative mappings. When you use “utilize,” a tooltip suggests “use.” “Approximately” becomes “about.” “Implement” becomes “do” or “carry out.” These are not grammar rules — they are style suggestions, the kind of advice a human editor would give.
I want to be honest about accuracy. Passive voice detection at roughly 80% accuracy is not perfect. The be-verb + past participle heuristic will miss some passive constructions (“The report got submitted”) and occasionally flag false positives (“She was interested in the topic,” where “interested” functions as an adjective). Similarly, adverb detection will miss adverbs that do not end in -ly (“very,” “quite,” “almost”). A full NLP parser would handle these cases, but it would also require loading a multi-megabyte model into the browser. The heuristic approach catches the majority of cases and runs in milliseconds. For a writing feedback tool, that trade-off is the right one.
What I Learned
Three lessons stood out from this build.
Context makes scores meaningful. A readability grade of 8.2 is an abstract number. “Reads like a newspaper article” is an experience people can relate to. Every time I have added a comparison layer to a numeric tool — in the Token Counter, in the Word Counter, and now here — engagement goes up. People do not just want data. They want to understand what the data means for them.
“Good enough” accuracy beats perfect but slow. The syllable counter is 85–90% accurate. The passive voice detector is around 80%. A pronunciation dictionary or NLP model would push those numbers higher, but at the cost of megabytes of downloads and seconds of loading time. For readability analysis, where the results are already approximations and small errors tend to cancel out across a full text, fast and mostly-right is more valuable than slow and precisely-right.
contentEditable cursor restoration took more time than all seven algorithm implementations combined. This is not an exaggeration. The math behind Flesch-Kincaid, Gunning Fog, Coleman-Liau, SMOG, ARI, Dale-Chall, and Flesch Reading Ease is well-documented and straightforward to implement. Saving a cursor position with the Range API, restoring it with a TreeWalker after the DOM has been completely replaced, handling paste events, and debouncing re-highlights — that was the real engineering challenge. If you are building anything with contentEditable and live HTML replacement, budget three times more time than you think you need.